Introduction:
The Indian electoral landscape is a tapestry woven with the threads of democracy, diversity, and determination. With its rich history, monumental statistics, and awe-inspiring feats, Indian elections stand as a testament to the world’s largest democratic exercise. Let’s embark on a journey through time, exploring the evolution, winners, margins, voter demographics, and remarkable milestones of Indian elections.
Evolution of Indian Elections:
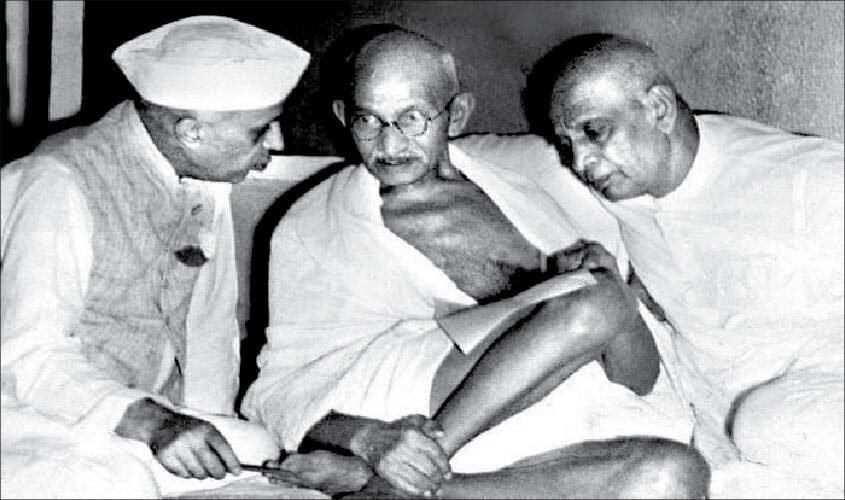
India’s tryst with democracy began in 1952 when the first general elections were held after gaining independence from British rule. Since then, elections have been held regularly every five years, showcasing the resilience and vibrancy of India’s democratic fabric. Over the decades, the electoral process has evolved, embracing technological advancements while staying true to its foundational principles of inclusivity and representation.
Historical Milestones:
The history of Indian elections is marked by several significant milestones:
- 1952: The First General Elections – A historic moment as India conducted the world’s largest democratic exercise, with over 173 million eligible voters.
- 1977: The End of Emergency – After the imposition of Emergency in 1975, the 1977 elections marked a return to democracy and saw the defeat of the ruling party.
- 1991: Introduction of Electronic Voting Machines (EVMs) – Revolutionizing the electoral process, EVMs were introduced to enhance transparency and efficiency.
- 2014: Digital Campaigning – The advent of social media transformed election campaigning, enabling political parties to reach millions of voters with targeted messages.
Winners and Margins:
Here’s a table showcasing the dates, winners, political parties, and their vote shares for selected Indian general elections:
| Year | Date | Winner | Political Party | Vote Share (%) |
|---|---|---|---|---|
| 1952 | Oct 25, 1951 | Jawaharlal Nehru | Indian National Congress (INC) | 45.0 |
| 1957 | Feb 26, 1957 | Jawaharlal Nehru | Indian National Congress (INC) | 47.8 |
| 1962 | Feb 19, 1962 | Jawaharlal Nehru | Indian National Congress (INC) | 44.7 |
| 1967 | Feb 17, 1967 | Indira Gandhi | Indian National Congress (INC) | 40.8 |
| 1971 | Mar 1, 1971 | Indira Gandhi | Indian National Congress (INC) | 43.7 |
| 1977 | Mar 16, 1977 | Morarji Desai | Janata Party | 41.0 |
| 1980 | Jan 3, 1980 | Indira Gandhi | Indian National Congress (I) | 42.7 |
| 1984 | Dec 24, 1984 | Rajiv Gandhi | Indian National Congress (I) | 49.1 |
| 1989 | Nov 22, 1989 | Vishwanath Pratap Singh | Janata Dal | 38.9 |
| 1991 | May 20, 1991 | P. V. Narasimha Rao | Indian National Congress (I) | 36.4 |
| 1996 | Apr 27, 1996 | Atal Bihari Vajpayee | Bharatiya Janata Party (BJP) | 20.3 |
| 1998 | Feb 16, 1998 | Atal Bihari Vajpayee | Bharatiya Janata Party (BJP) | 25.6 |
| 1999 | Oct 13, 1999 | Atal Bihari Vajpayee | Bharatiya Janata Party (BJP) | 23.8 |
| 2004 | May 10, 2004 | Manmohan Singh | Indian National Congress (INC) | 26.7 |
| 2009 | May 7, 2009 | Manmohan Singh | Indian National Congress (INC) | 28.6 |
| 2014 | Apr 7, 2014 | Narendra Modi | Bharatiya Janata Party (BJP) | 31.0 |
| 2019 | Apr 11, 2019 | Narendra Modi | Bharatiya Janata Party (BJP) | 37.4 |
This table provides a snapshot of selected Indian general elections, highlighting the winning party, their leader, and the percentage of votes garnered.
The list of winning parties and their margins in Indian elections reflects the dynamic nature of the political landscape. From landslide victories to closely contested battles, each election tells a unique story of political triumph and resilience.
Here are some notable winners and their margins:
- 1971: Indian National Congress (INC) led by Indira Gandhi secured a resounding victory with a margin of over 125 seats.
- 1984: After the assassination of Prime Minister Indira Gandhi, INC, under Rajiv Gandhi’s leadership, won by a landslide, securing over 400 seats.
- 2014: Bharatiya Janata Party (BJP) led by Narendra Modi won with a historic mandate, securing over 280 seats, marking the first single-party majority in decades.
- 2019: BJP secured a landslide victory once again, expanding its mandate and consolidating power with over 300 seats.
Here’s a table showcasing the highest vote-getting candidates and the winner with the highest margin in selected Indian general elections:
Highest Vote-Getting Candidates:
| Year | Candidate | Constituency | Party | Votes Received |
|---|---|---|---|---|
| 2019 | Narendra Modi | Varanasi, Uttar Pradesh | BJP | 6,69,602 |
| 2014 | Narendra Modi | Varanasi, Uttar Pradesh | BJP | 5,81,022 |
| 2009 | P. Chidambaram | Sivaganga, Tamil Nadu | INC | 5,61,766 |
| 2004 | Sonia Gandhi | Rae Bareli, Uttar Pradesh | INC | 4,01,724 |
| 1999 | Sonia Gandhi | Bellary, Karnataka | INC | 5,25,586 |
| 1998 | Atal Bihari Vajpayee | Lucknow, Uttar Pradesh | BJP | 4,53,426 |
| 1996 | Atal Bihari Vajpayee | Lucknow, Uttar Pradesh | BJP | 2,59,880 |
| 1991 | Rajiv Gandhi | Amethi, Uttar Pradesh | INC | 4,53,139 |
| 1989 | Vishwanath Pratap Singh | Fatehpur, Uttar Pradesh | JD | 5,40,463 |
| 1984 | Rajiv Gandhi | Amethi, Uttar Pradesh | INC | 5,28,192 |
| 1980 | Sanjay Gandhi | Amethi, Uttar Pradesh | INC | 3,87,782 |
| 1977 | Atal Bihari Vajpayee | New Delhi, Delhi | JP | 3,95,444 |
| 1971 | Indira Gandhi | Rae Bareli, Uttar Pradesh | INC | 3,36,309 |
| 1967 | Indira Gandhi | Rae Bareli, Uttar Pradesh | INC | 2,76,005 |
| 1962 | Jawaharlal Nehru | Phulpur, Uttar Pradesh | INC | 2,02,330 |
| 1957 | Jawaharlal Nehru | Phulpur, Uttar Pradesh | INC | 2,82,511 |
| 1952 | Jawaharlal Nehru | Allahabad, Uttar Pradesh | INC | 2,74,918 |
Number of Voters and Demographics:
India’s electorate is as diverse as its culture, encompassing a vast spectrum of demographics, languages, and socio-economic backgrounds. With each election, the number of eligible voters continues to rise, reflecting the country’s growing population and democratic participation. The demographic composition of voters varies across regions, with urban areas witnessing higher voter turnout compared to rural regions.
- Urban vs. Rural Turnout: While urban areas boast higher literacy rates and awareness, rural regions often witness strong voter mobilization efforts, influenced by local leaders and community networks.
- Youth Participation: With a significant portion of India’s population below the age of 35, youth participation in elections is increasingly crucial, shaping political discourse and policy priorities.
Conclusion:
Indian elections stand as a beacon of democracy, embodying the collective aspirations and voices of its diverse populace. As the world’s largest democracy, India continues to inspire and lead by example, demonstrating the power of inclusive governance and electoral participation. With each election, the journey of Indian democracy evolves, navigating new challenges and embracing innovation, while staying grounded in its core values of liberty, equality, and fraternity.

